What is Customer Acquisition Cost (CAC) and Why Does It Matter?
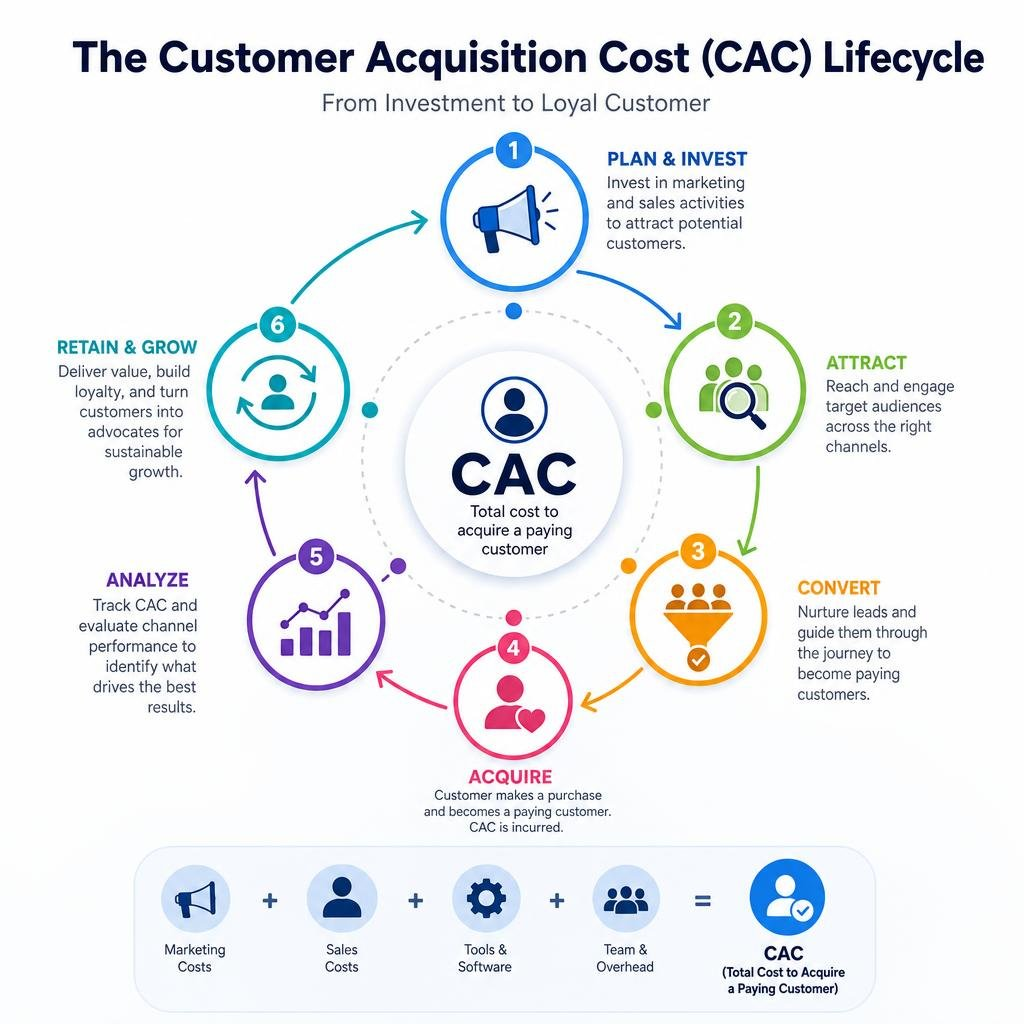
Customer Acquisition Cost (CAC) is a fundamental metric that measures the total expense a business incurs to gain a new customer. This isn’t just about ad spend; it encompasses all sales and marketing efforts, resources, and overhead dedicated to convincing a prospective customer to make a purchase. In July 2026, with acquisition costs consistently on the rise, understanding and meticulously managing CAC is no longer optional – it’s a prerequisite for survival and sustainable growth.
A healthy CAC is intrinsically linked to a business’s long-term viability and profitability. If the cost to acquire a customer consistently exceeds the revenue they generate over their lifetime (Customer Lifetime Value, or LTV), the business model is unsustainable. By tracking CAC, companies can assess the true return on investment (ROI) of their marketing campaigns, optimize their spending, and ensure that their profit margins remain robust. It also provides crucial insights into cash flow management, as upfront acquisition costs need to be recovered efficiently.
Defining CAC vs. CPA (Cost Per Acquisition)
While often used interchangeably, Customer Acquisition Cost (CAC) and Cost Per Acquisition (CPA) serve distinct purposes in marketing analytics. The key differentiator lies in what “acquisition” signifies for each metric.
Customer Acquisition Cost (CAC)specifically measures the cost to acquire a paying customer. This means the individual or business has completed the purchase journey and become a revenue-generating client. CAC is a high-level business metric, reflecting the overall efficiency of an organization’s sales and marketing engine in converting prospects into loyal customers.
Cost Per Acquisition (CPA), on the other hand, is a more granular, campaign-level metric. CPA tracks the cost associated with a specific conversion action that isn’t necessarily a final purchase. This could be a lead generation (e.g., a form submission, a download, a free trial sign-up), an app install, or even an email newsletter subscription. CPA helps marketers optimize individual campaigns by identifying the most cost-effective ways to achieve specific intermediate goals within the marketing funnel.
For example, a company might have a CPA of $5 for a new lead, but a CAC of $50 if it takes 10 leads, on average, to convert one into a paying customer. Understanding this distinction is vital for accurate budgeting and performance evaluation.

The Strategic Role of a Priority Marketing Customer Acquisition Cost Framework
Implementing a robust framework for managing customer acquisition costs is paramount for any business aiming for strategic alignment and optimal resource allocation. A well-defined approach to understanding your Priority Marketing customer acquisition cost transforms CAC from a mere number into a powerful strategic tool. It allows businesses to move beyond simply tracking expenses to actively shaping their growth trajectory.
Such a framework enables companies to:
- Align Sales and Marketing: By providing a unified view of acquisition efficiency, it fosters collaboration between sales and marketing teams, ensuring their efforts are synchronized towards profitable customer acquisition.
- Optimize Budget Allocation: Detailed CAC analysis, broken down by channel and segment, empowers businesses to reallocate marketing and sales budgets to the most effective channels, maximizing ROI and minimizing wasted spend.
- Inform Growth Planning: Understanding the true cost of growth allows for more realistic forecasting and strategic planning. It helps determine how aggressively a company can scale while maintaining profitability.
- Enhance Investor Confidence: For startups and growth-stage companies, demonstrating a clear understanding and control over CAC, especially in relation to Customer Lifetime Value (LTV), is crucial for attracting and retaining investor interest.
By embracing a comprehensive approach to their customer acquisition cost, businesses can gain invaluable insights that drive smarter decisions, optimize spending, and ultimately achieve more sustainable and profitable growth.
How to Calculate Customer Acquisition Cost: Simple vs. Complex Formulas
Accurately calculating CAC is the first step toward managing it effectively. However, what constitutes “total cost” can vary significantly, leading to two primary calculation methods: the simple approach and the complex, or “fully loaded,” approach. The choice of method depends on the level of detail and accuracy required for your analysis.
The Simple CAC Formula
The simple CAC formula provides a quick, high-level overview of acquisition costs, often focusing solely on direct marketing expenditures. It’s useful for initial assessments or when comparing the efficiency of specific marketing campaigns.
Simple CAC Formula: $$ \text{CAC} = \frac{\text{Total Marketing Campaign Costs (MCC)}}{\text{Total Customers Acquired (CA)}} $$
- Total Marketing Campaign Costs (MCC): This includes direct expenses related to marketing campaigns, such as advertising spend on platforms like Google Ads, Meta Ads, print media, or direct mail. It generally excludes salaries, software, or overhead.
- Total Customers Acquired (CA): This is the number of new paying customers acquired during the same measurement period as the MCC.
Example: If a business spends $10,000 on advertising in a month and acquires 100 new customers, its simple CAC is $100 ($10,000 / 100).
While easy to calculate, the simple CAC can be misleading as it doesn’t account for the full spectrum of resources invested in customer acquisition.
The Complex (Fully Loaded) CAC Formula
For a true and comprehensive understanding of customer acquisition costs, the complex, or “fully loaded,” CAC formula is essential. This method incorporates all expenses directly and indirectly related to acquiring new customers, providing a more accurate reflection of the actual investment.
Complex CAC Formula: $$ \text{CAC} = \frac{(\text{MCC} + \text{W} + \text{S} + \text{PS} + \text{O})}{\text{CA}} $$
Where:
- MCC (Marketing Campaign Costs):As above, direct advertising, content creation, and promotional expenses.
- W (Wages): Salaries and commissions for sales and marketing teams, including managers, representatives, and support staff directly involved in acquisition efforts.
- S (Software): Costs of all sales and marketing software used for acquisition, such as CRM systems, marketing automation platforms, analytics tools, A/B testing software, and email marketing services.
- PS (Professional Services):Expenses for external agencies, consultants, designers, or freelancers hired for acquisition-related tasks.
- O (Overhead): A portion of general overhead expenses allocated to sales and marketing, such as office rent, utilities, and equipment depreciation. This allocation should be proportional to the space and resources used by acquisition teams.
- CA (Customers Acquired): The number of new paying customers acquired during the specified period.
Example: If the previous business’s total marketing campaign costs were $10,000, but they also spent $5,000 on sales salaries, $1,000 on marketing software, $500 on a design consultant, and $500 on allocated overhead for the month, and still acquired 100 customers, their complex CAC would be $170 (($10,000 + $5,000 + $1,000 + $500 + $500) / 100).
Using the fully loaded CAC provides a more realistic picture of profitability and is crucial for making informed strategic decisions.
Feature Simple CACComplex (Fully Loaded) CAC Costs Included
Direct marketing/ad spend Direct marketing/ad spend, salaries, software, professional services, overhead AccuracyLower; can underestimate true cost Higher; provides a holistic view of investment Use CaseQuick campaign performance checks, initial estimates Strategic planning, profitability analysis, investor reporting Insights GainedChannel-specific ad efficiency Overall business efficiency, unit economics, resource allocation ComplexityLow High; requires detailed expense tracking Risk of Misleading Higher; may mask underlying inefficiencies Lower; reveals the full financial picture Industry Benchmarks and Segment Variations in 2026
Customer Acquisition Cost is rarely a one-size-fits-all metric. It varies significantly across industries and market segments, influenced by factors like sales cycle length, product complexity, target audience, and competitive landscape. Understanding these benchmarks in July 2026 is crucial for evaluating your own performance.
Average CAC Benchmarks by Industry
In 2026, the average CAC across ten diverse industries stands at approximately $606. However, this blended average masks substantial differences between sectors:
- B2B SaaS: With a combined average CAC of $239, B2B SaaS often benefits from scalable digital marketing and product-led growth strategies. However, this can range from under $300 for consumer SaaS to $300 to $5,000+ for B2B SaaS, and even peak at $14,772 for enterprise SaaS due to longer sales cycles and higher customer lifetime values.
- Retail/E-commerce: Consumer e-commerce has one of the lowest average CACs at around $64, reflecting high-volume, lower-ticket transactions. Retail CAC varies by channel, with email marketing being very efficient ($15.92) and influencer marketing being higher ($73.58).
- Fintech: This industry sees a higher average CAC of $1,450. This is driven by regulatory complexities, the need for trust, and often a higher value per customer. Enterprise fintech CAC can be particularly high, reaching up to $14,772 due to complex sales and compliance.
- Financial Services: Broader financial services have a combined average CAC of $784, with paid channels significantly more expensive ($1,202) than organic ($644).
- Higher Education: This sector consistently exhibits the highest combined average CAC at $1,143. This is largely due to highly targeted audiences, extensive recruitment efforts, and long decision-making processes.
- Other Industries: Construction ($281), Entertainment ($260), IT and Managed Services ($454), Legal Services ($749), and Manufacturing ($723) all fall within various points of this spectrum, each with unique drivers for their acquisition costs.
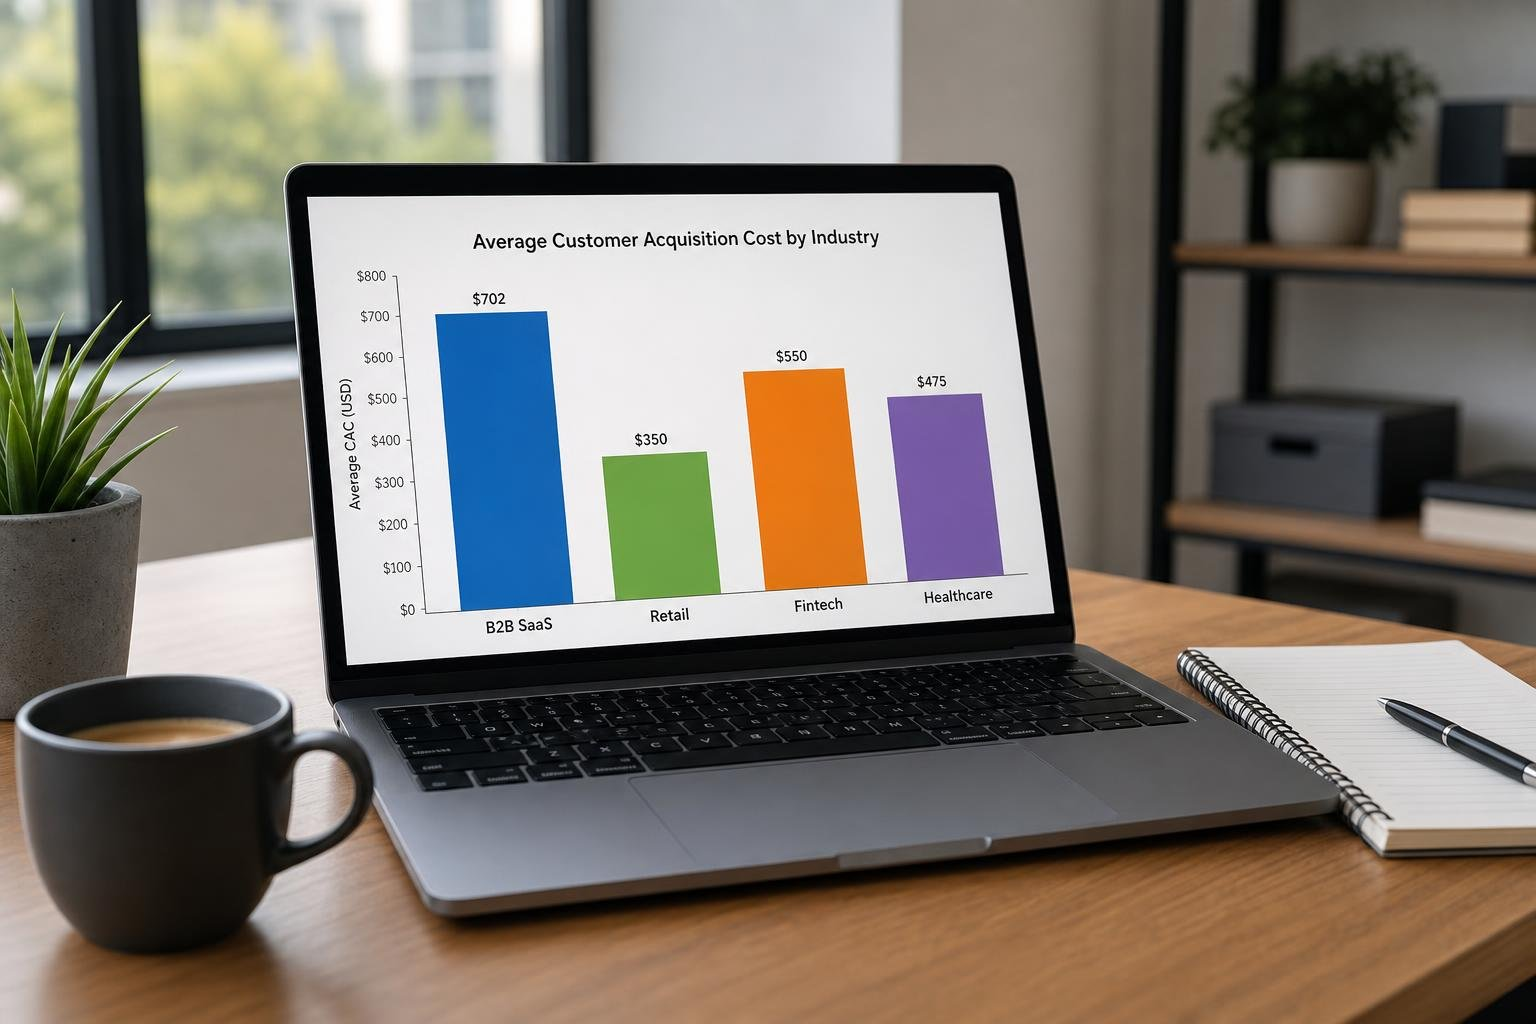
These industry averages serve as valuable reference points, but internal factors can cause significant deviations.
How CAC Scales Across Customer Segments
Beyond industry, the specific customer segment a business targets profoundly impacts its CAC. As a general rule, the more complex the sale and the higher the potential customer lifetime value, the higher the acquisition cost.
- Consumer Segment: Typically has the lowest CAC, often under $300 (e.g., consumer SaaS, e-commerce). Acquisition strategies here rely on broad reach, digital advertising, and often self-service models.
- SMB (Small and Medium-sized Business) Segment: CAC for SMBs is moderately higher than for consumers. For instance, Fintech SMB CAC averages $1,450. These customers often require more direct sales engagement but still have relatively streamlined sales cycles.
- Mid-Market Segment: As businesses grow, their needs become more complex, leading to higher CAC. Mid-market Fintech, for example, sees an average CAC of $4,903. This segment often involves multiple stakeholders and a more consultative sales approach.
- Enterprise Segment: This segment commands the highest CAC, with some enterprise SaaS reaching $14,772 and enterprise Fintech peaking at $14,772. Enterprise sales cycles are long, involve numerous decision-makers, extensive customization, and significant upfront investment in sales personnel and professional services. The research indicates that CAC can increase by more than 10x from SMB to enterprise segments.
This scaling of CAC by segment highlights the importance of segmenting your acquisition costs for accurate analysis. A blended CAC that includes both SMB and enterprise customers might obscure the true unit economics of each segment.
Optimizing Your Priority Marketing Customer Acquisition Cost
Optimizing your customer acquisition cost is not just about cutting expenses; it’s about maximizing efficiency and ensuring that every dollar spent generates proportional or greater value. This involves a holistic approach that considers not only the initial acquisition but also the long-term customer relationship.
Understanding the LTV:CAC Ratio
The Customer Lifetime Value (LTV) to Customer Acquisition Cost (CAC) ratio is arguably the most critical metric for evaluating the health and sustainability of a business’s growth strategy. It tells you how much revenue a customer is expected to generate over their relationship with your company compared to how much it cost to acquire them.
The Ideal LTV:CAC Ratio: The widely accepted benchmark for a healthy LTV:CAC ratio is 3:1. This means that for every dollar spent on acquiring a customer, that customer should generate three dollars in revenue over their lifetime.
- LTV:CAC < 1:1: The business is losing money on every customer acquired. This is unsustainable.
- LTV:CAC = 1:1: The business is breaking even on acquisition, but likely not profitable once service costs are factored in.
- LTV:CAC = 3:1: This is considered a very good level, indicating solid unit economics and that customers are being acquired at a profitable rate.
- LTV:CAC > 3:1: While seemingly excellent, a ratio significantly higher than 3:1 (e.g., 5:1 or more) can sometimes indicate underinvestmentin customer acquisition. It suggests there might be untapped market potential that could be captured by increasing marketing spend without compromising profitability.
Analyzing this ratio helps businesses understand their unit economics, predict future profitability, and make informed decisions about scaling their acquisition efforts.
Calculating the CAC Payback Period
The CAC Payback Period measures the time it takes to recoup the investment made in acquiring a new customer. This metric is particularly vital for subscription-based businesses (like SaaS) where revenue is generated over time.
CAC Payback Period Formula: $$ \text{Payback Period (Months)} = \frac{\text{CAC}}{\text{Average Monthly Recurring Revenue (ARPU) per customer} \times \text{Gross Margin Percentage}} $$
- CAC: The fully loaded customer acquisition cost.
- ARPU: Average Revenue Per User/Customer per month.
- Gross Margin Percentage: The percentage of revenue left after deducting the cost of goods sold (COGS) or cost of service.
Example: If your fully loaded CAC is $1,800, your ARPU is $150, and your gross margin is 80%, the payback period would be: $$ \frac{\$1,800}{\$150 \times 0.80} = \frac{\$1,800}{\$120} = 15 \text{ months} $$
Healthy Benchmark: A healthy CAC payback period is typically under 12 months for SaaS and subscription businesses. Top-performing SaaS companies often aim for 5-7 months. A longer payback period can strain cash flow, especially for growing companies. Understanding and optimizing this period is crucial for financial planning and sustainable scaling.
Organic CAC vs. Paid CAC
Distinguishing between organic and paid CAC is fundamental for strategic channel allocation. Organic channels typically involve unpaid efforts that build long-term assets, while paid channels involve direct expenditure for immediate reach.
- Organic CAC: This measures the cost of acquiring customers through unpaid channels such as search engine optimization (SEO), content marketing, social media (unpaid posts), referrals, and word-of-mouth. While not “free,” organic channels require investment in content creation, SEO specialists, community management, and product-led growth initiatives. Organic CAC is almost always significantly lower than paid CAC. For B2B, average organic CAC is $942 compared to paid CAC of $1,907. Thought leadership SEO, for example, can have a B2B CAC as low as $647.
- Paid CAC: This measures the cost of acquiring customers through direct advertising spend on platforms like Google Ads, Meta Ads, display networks, and paid social media. Paid channels offer immediate scalability and precise targeting but come with a higher per-customer cost. Paid search averages $802 per customer, and Account-Based Marketing (ABM) can be as high as $4,664.
The strategic insight here is that while paid channels offer speed, organic channels build compounding long-term value and significantly reduce your blended CAC over time. A balanced approach, leveraging paid for immediate impact and organic for sustainable growth, is often the most effective strategy.
Actionable Strategies to Lower Your Priority Marketing Customer Acquisition Cost
Reducing CAC is a continuous process that requires data-driven decision-making and a focus on customer value. Here are key strategies businesses can implement:
- Enhance Personalization:Personalization can reduce CAC by as much as 50% and lift revenues by 5-15%. Tailoring marketing messages, product recommendations, and website experiences to individual customer preferences increases relevance and conversion rates, making your acquisition efforts more efficient.
- Optimize Onboarding and Activation: A poor onboarding experience wastes acquisition spend. The average SaaS activation rate is just 37.5%, meaning 62.5% of users drop off before experiencing real value. Implement guided onboarding flows, interactive tutorials, and in-app messaging to ensure new users quickly understand and adopt your product’s core features. This increases the likelihood of retention and improves the effective CAC.
- Prioritize Customer Retention:Acquiring a new customer is 5 to 25 times more expensive than retaining an existing one. A 5% improvement in customer retention can produce 25-95% profit increases. By reducing churn and increasing customer lifetime value, you effectively lower the pressure on new customer acquisition. Loyalty programs, exceptional customer service, and proactive engagement are crucial here. Businesses have a 60-70% probability of selling to an existing customer versus only 5-20% for new prospects.
- Improve On-Site Conversion Rates:Your website is a critical lever. A poor website experience means you’re paying for traffic that bounces. Optimizing page load speed, simplifying navigation, clarifying calls-to-action, and ensuring mobile responsiveness can significantly boost conversion rates. Doubling your conversion rate effectively halves your CAC for the same traffic volume.
- Leverage Product-Led Growth (PLG): For many software and digital products, a freemium model or free trial can significantly lower CAC by allowing users to experience value before committing to a purchase. This generates organic interest and word-of-mouth referrals.
- Refine Audience Targeting:Continuously analyze your ideal customer profile and segment your audience. Sharpening your targeting ensures your marketing messages reach those most likely to convert, reducing wasted ad spend.
- Cultivate Referral Programs:Referred customers often have a lower CAC and higher LTV. Implement structured referral programs that incentivize existing customers to bring in new ones. This leverages your satisfied customer base as an organic acquisition channel.
Here’s a list of key tactics to reduce customer acquisition costs:
- Implement AI-driven personalization for marketing and on-site experiences.
- Design interactive, value-driven onboarding flows.
- Invest in customer success to boost retention and reduce churn.
- A/B test landing pages and website elements for conversion rate optimization.
- Utilize data analytics to identify and fix in-product drop-off points.
- Develop a strong content marketing strategy for organic lead generation.
- Launch a robust customer referral program.
- Optimize ad spend by continuously testing creatives, audiences, and platforms.
- Focus on building a strong brand reputation through thought leadership.
Frequently Asked Questions about Customer Acquisition Cost
Navigating the complexities of customer acquisition cost often leads to common questions. Here, we address some of the most frequent inquiries to provide clarity and practical insights.
What is a good customer acquisition cost?
A “good” customer acquisition cost is not an absolute number but rather a relative metric, primarily evaluated in conjunction with your Customer Lifetime Value (LTV). The universally accepted benchmark for a healthy LTV:CAC ratio is 3:1. This means that for every dollar you spend to acquire a customer, that customer should generate at least three dollars in revenue over their lifetime. If your ratio is significantly lower (e.g., 1:1 or less), you are likely losing money on each customer. If it’s much higher (e.g., 5:1+), you might be underinvesting in growth opportunities. Industry benchmarks also provide context; for example, a CAC of $250 might be excellent for a B2B SaaS company but unsustainable for a low-margin e-commerce business.
Why is customer acquisition cost increasing?
Customer acquisition costs have been on a significant upward trend, rising approximately 60% over the past five years and a staggering 222% over the last eight years. Several factors contribute to this:
- Increased Competition: More businesses are vying for attention on the same digital platforms, driving up bid prices for keywords and ad placements.
- Platform Changes & Privacy Regulations: iOS 14.5+ privacy changes, for instance, have reduced the precision of paid ad targeting by 23%, making it harder and more expensive to reach the right audience. Upcoming deprecation of third-party cookies is expected to further increase display advertising CAC by 25-40%.
- Ad Fatigue: Consumers are increasingly desensitized to generic ads, requiring more creative, personalized, and thus often more expensive, campaigns to capture attention.
- Rising Labor and Software Costs:The fully loaded CAC includes salaries for sales and marketing teams, as well as the cost of sophisticated software tools, all of which have seen inflationary increases.
- Shift to Organic Channels: As businesses shift budgets from paid to organic channels, competition for top talent and premium tools in areas like SEO and content marketing also drives up costs.
These combined pressures necessitate a more efficient and strategic approach to acquisition.
How does customer retention impact CAC?
Customer retention has a profound, albeit indirect, impact on your effective CAC. While retention efforts don’t directly lower the cost of acquiring new customers, they significantly improve the overall profitability of your customer base, making your initial acquisition investment more worthwhile.
- Increases LTV: Retained customers generate more revenue over a longer period, boosting their Customer Lifetime Value (LTV). Since CAC is evaluated against LTV, a higher LTV makes your existing CAC more sustainable. A 5% improvement in customer retention can produce 25-95% profit increases.
- Reduces Need for New Acquisitions:When existing customers stay longer and potentially expand their spending (expansion revenue), the pressure to constantly acquire new customers to meet growth targets is lessened. This allows businesses to be more selective and efficient with their new acquisition spend.
- Generates Referrals: Satisfied, retained customers are more likely to refer new customers, which is one of the lowest CAC channels available. Referral CAC can be significantly lower than paid channels, effectively reducing your blended CAC.
- Lowers Effective CAC: By maximizing the value from each acquired customer, you essentially “dilute” the initial acquisition cost over a longer, more profitable relationship, improving your unit economics without necessarily cutting upfront marketing spend.
Investing in retention is often the most cost-effective way to improve your overall customer acquisition efficiency and ensure sustainable business growth.
Conclusion
In an economic landscape where customer acquisition costs continue their upward trajectory, understanding, calculating, and diligently optimizing your CAC is no longer a strategic advantage—it’s a fundamental requirement for business survival and sustainable growth. We’ve explored the nuances of CAC, from its basic definition to the complexities of fully loaded calculations, and distinguished it from related metrics like CPA.
We’ve also delved into the varying industry benchmarks and how CAC scales dramatically across customer segments, reinforcing the need for tailored strategies. Crucially, we highlighted the indispensable role of the LTV:CAC ratio and the CAC payback period in evaluating the true health of your unit economics.
The path to a lower, more efficient CAC lies in a multi-faceted approach: embracing personalization, optimizing onboarding for higher activation, prioritizing customer retention over constant new acquisition, and strategically balancing organic and paid channels. By adopting these insights and continuously refining your acquisition strategies, businesses can navigate the challenges of rising costs, ensure profitability, and build a resilient foundation for future expansion.